
Main
The differentiation of human pluripotent stem cells (PS cells) into repopulating hematopoietic stem cells (HSCs) could provide novel therapeutic options for a range of hematopoietic disorders. For example, HSCs derived from patient induced PS cells (iPS cells)1 could circumvent the donor–host mismatch that leads to graft-versus-host-disease, a major source of morbidity and mortality in recipients of imperfectly matched allogenic transplants2. HSCs derived from genome-edited iPS cells could treat patients by correcting genetic causes of blood diseases, such as bone marrow failure syndromes3. Modeling of hematopoietic development or diseases using gene-edited iPS cell-derived cells4,5,6,7,8 could accurately recapitulate aberrant hematopoiesis, thereby facilitating the development of more effective therapies.
The earliest human blood cells develop extraembryonically in distinct waves from the yolk sac (YS)9,10. Intraembryonic hematopoietic cells, whose descendants form the adult blood system, develop separately in the aorta–gonad–mesonephros (AGM) region, where they bud from the aortic wall between days 27 and 40 of gestation (Carnegie stages (CS) 13–17)10,11. Following their emergence from the aorta, these preHSCs mature and colonize the fetal liver and, in the process, acquire robust repopulating capacity10. The functional HSC pool then expands in the fetal liver before seeding the bone marrow10. Although the AGM of day 32–41 (CS14–17) human embryos generates predominantly preHSCs, it also produces infrequent repopulating HSCs (~1 per embryo)12.
The generation of repopulating HSCs from PS cells has proved challenging, partly because of difficulties in distinguishing cells representing AGM-type hematopoiesis from those similar to the YS that cannot engraft. However, it was found that HOXA gene expression could be distinguished between YS-derived HOXA-negative and AGM-derived HOXA-positive cells, providing a critical marker for guiding directed differentiation of iPS cells to repopulating HSCs13,14. Subsequently, we and others found that culturing the mesoderm with the Wnt agonist CHIR99201 (refs. 15,16) and/or the anaplastic lymphoma kinase (ALK) inhibitor SB431542 (ref. 17) patterned cells to a HOXA-positive state, mimicking an AGM-like differentiation trajectory18. The gene expression pattern of iPS cell-derived cells following this trajectory resembled that of cells in the AGM of day 32 embryos (CS14), when the first repopulating human HSCs arise13,18. However, it was not known whether this similarity in gene expression would also translate into a functional similarity.
Here, we established an iPS cell differentiation protocol that generated CD34+ HSCs (denoted iHSCs) capable of multilineage engraftment (MLE). Key elements of the protocol included a defined medium and cryopreservation of CD34+ cells for compatibility with future clinical applications. Our experiments revealed that the endowment of CD34+ hematopoietic cells with MLE capacity in immune-deficient mice depended on the timed provision of Wnt agonists, retinoic acid precursors and vascular endothelial growth factor (VEGF), reflecting the roles of these molecules in the specification of the hematopoietic system19,20,21. These studies lay the groundwork for further dissection of HSC formation from iPS cells and eventual clinical translation.
ResultsDifferentiation of iPS cells to CD34-expressing hematopoietic cells
For all differentiation protocols, iPS cells were dissociated and seeded into dishes that were incubated on a rotating platform, allowing the formation of swirling embryoid bodies (EBs) that differentiated to hematopoietic cells13,22 (Fig. 1a,b and Supplementary Results 1; see Extended Data Fig. 1a for an overview of differentiation protocols and Methods for details of growth factor combinations). Mesoderm was induced for 24 h, patterned for 2 days to induce the expression of HOXA genes18 and differentiated to hemogenic endothelium from days 3 to 7. Cells undergoing an endothelial-to-hematopoietic transition protruded from the surface of the EBs, reminiscent of intra-arterial hematopoietic clusters of blood cells emerging from the embryonic aorta10,11 (Fig. 1c). These cellular accumulations broke away from the EBs, shedding blood cells into the medium from day 11 (Fig. 1c). Cultures on day 14 comprised a dominant blood cell suspension with most cells expressing CD34, CD90, CD44 and Kit (Fig. 1d and Supplementary Fig. 1). The EB-derived fraction consisted of the stroma, the endothelium and hematopoietic cells that had not yet shed into the medium (Fig. 1e and Supplementary Fig. 1). A small proportion of the hematopoietic cells expressed CXCR4 or CD73, reflecting their recent emergence from an endothelial precursor (Fig. 1e). From days 14 to 16, the suspension hematopoietic cells were harvested and cryopreserved (Fig. 1d). In some experiments, CD34+ cells enriched from EBs by magnetic-activated cell sorting (MACS) (Fig. 1e) were also cryopreserved.
Fig. 1: In vitro hematopoietic differentiation of iPS cells.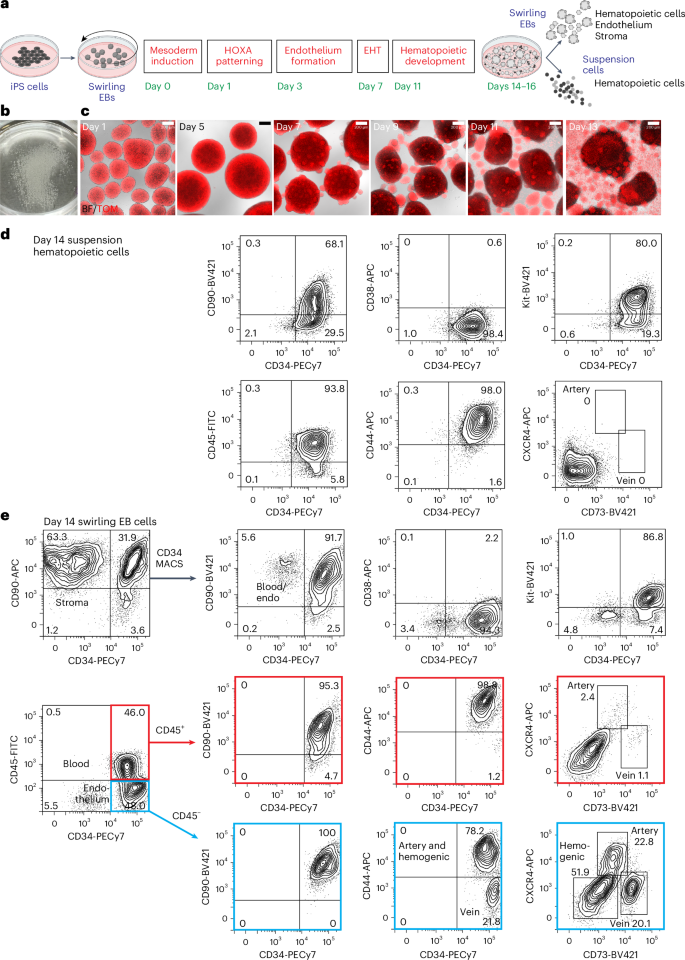
a, Swirling EB differentiation protocol indicating differentiation stages transitioning from undifferentiated iPS cells to hematopoietic, endothelial and stromal cells. Growth factors for each stage are shown in Extended Data Fig. 1a and the Methods. EHT, endothelial-to-hematopoietic transition. Partially created using BioRender.com. b, A 60-mm dish on day 7 showing hundreds of swirling EBs. c, Overlaid bright-field (BF) and tandem TOMATO (TOM) fluorescence images of developing swirling EB cultures. Scale bar, 200 µm. d, Flow cytometry of day 14 suspension hematopoietic cells showing the expression of surface CD45, CD34, Kit, CD44 and CD90. e, Dissociated day 14 swirling EB cells were typically enriched to >90% CD34+ endothelium and blood using MACS. These cells comprised CD45+ blood cells (profiles with red borders) and CD45− endothelium (profiles with blue borders). The endothelium was categorized as arterial, venous or hemogenic on the basis of the expression of CD34, CD44, CXCR4 and CD73 (ref. 15). The flow cytometry results in d,e are from one representative experiment of more than 20 experiments performed.
MLE cells require retinoids during iPS cell differentiation
We screened combinations of CHIR, Activin A, bone morphogenetic protein 4 (BMP4) and a retinoid during the mesoderm induction and patterning stages (screening protocol 1; Methods and Extended Data Fig. 1a,b) to determine whether any supported the generation of engraftable human hematopoietic cells. CD34+ hematopoietic cells were generated from an iPS cell line constitutively expressing a tandem TOMATO fluorescent protein (RM TOM) (Fig. 1c)23 and cryopreserved before thawing and injection into the tail vein of NOD,B6.Prkdcscid Il2rgtm1Wjl/SzJ KitW41/W41 (NBSGW) mice24, mimicking the workflow of clinical HSC transplantation (Fig. 2a,b). In this series of experiments, groups of mice (totaling 134, denoted cohort 1) were injected with cells differentiated under one of 12 mesoderm induction and patterning protocols in screening protocol 1 (Supplementary Results 2, Fig. 2a–f, Extended Data Fig. 1b–d and Supplementary Tables 1–3 and 13). Some mice (12/134) were engrafted by stem cells displaying multilineage differentiation resulting in erythroid, myeloid and lymphoid reconstitution (denoted MLE). We found that most mice in which MLE occurred received cells in which the mesoderm was induced with 4 µM CHIR on day 0 and a pulse of a retinoic acid precursor (retinol (ROL) or retinyl acetate (RETA)) was included from days 3 to 5 of differentiation (Fig. 2a–e). Indeed, 17.6% (9/51) of mice transplanted with cells treated with the combination of 4 µM CHIR and retinoid showed MLE (Fig. 2f). There were over 80% human cells occupying the bone marrow in some of these MLE cohort 1 recipients (average: 46.5% ± 10.0% human cells in bone marrow and 11.9% ± 5.1% in spleen) (Fig. 2f and Supplementary Tables 1 and 13), highlighting the capacity for differentiation of the engrafting cells. All MLE mice in cohort 1 and subsequent transplant cohorts were engrafted with ≥0.1% human cells (Supplementary Tables 13 and 19). Hereafter, we refer to these functionally defined iPS cell-derived multipotent hematopoietic cells with the capacity to engraft multiple lineages over a long term as ‘iHSCs’.
Fig. 2: MLE depends on CHIR and retinoids during iPS cell differentiation.
a, Swirling EB differentiation protocol (screening protocol 1; Extended Data Fig. 1a) indicating mesoderm induction factors provided during the first day of differentiation and retinoids during endothelium formation from days 3 to 5 to generate the 12 differentiation conditions transplanted into mice in cohort 1. Numbers indicate the concentration of CHIR (CH) in µM and concentrations of BMP4 (B) and Activin A (A) in ng ml−1. b, Transplantation workflow showing the cryopreservation of CD34+ hematopoietic cells from the cell suspension along with MACS-isolated CD34+ cells from the EB. MACS-enriched EB cells were not collected for all experiments. Cryopreserved cells were thawed and transplanted immediately into NBSGW immune-deficient mice by tail-vein injection. Peripheral blood was analyzed at 12 weeks to screen for engraftment and hematopoietic tissues were analyzed for human cells at time points up to 24 weeks (Supplementary Tables 2 and 3). c, Scatter dot plot correlating the percentage of bone marrow (BM) human cells with differentiation conditions in cohort 1. Error bars, mean ± s.e.m. The number of mice receiving cells subjected to each mesoderm induction (n) is shown. The number of unengrafted (NEG) mice is indicated for each condition. d, Scatter dot plot correlating the concentration of CHIR during mesoderm induction with the phenotype of engrafted human cells in the BM (colored circles). The number of mice displaying an MLE phenotype differed between those receiving cells treated with 4CH and 1CH. *P = 0.03, determined by a two-sided Fisher’s exact test. Error bars, mean ± s.e.m. Data from the 4CH 3B5A and 4CH 30A mesoderm inductions were pooled. e, Scatter dot plot correlating the inclusion of retinoid (ROL or RETA) during iPS cell differentiation with the phenotype of engrafted human cells in the BM (colored circles). The number of mice displaying an MLE phenotype differed between those receiving cells treated with or without retinoid. ROL or RETA versus NIL (no retinoid). *P = 0.03, determined by a two-sided Fisher’s exact test. Error bars, mean ± s.e.m. Data from the 4CH 3B5A and 4CH 30A mesoderm inductions were pooled. f, Phenotypes in 42/51 mice transplanted with cells treated with the combination of 4 µM CHIR and retinoid (RET) that showed engraftment. In total, 9/51 (17.6%) transplanted mice showed MLE. Error bars, mean ± s.e.m.
Transcriptional similarity of in vitro differentiated iPS cells and human AGM
To search for transcriptional signatures accounting for functional differences between cells differentiated with and without retinoid and to allow comparisons to published datasets of human AGM, we performed single-cell RNA sequencing (scRNA seq) of differentiated iPS cells13,25. Two iPS cell lines were profiled, the RM TOM line described above and an independent line in which the mTagBFP2 fluorescent protein23 was expressed from the GAPDH locus of PB1.1 iPS cells26 (denoted PB1.1 BFP).


